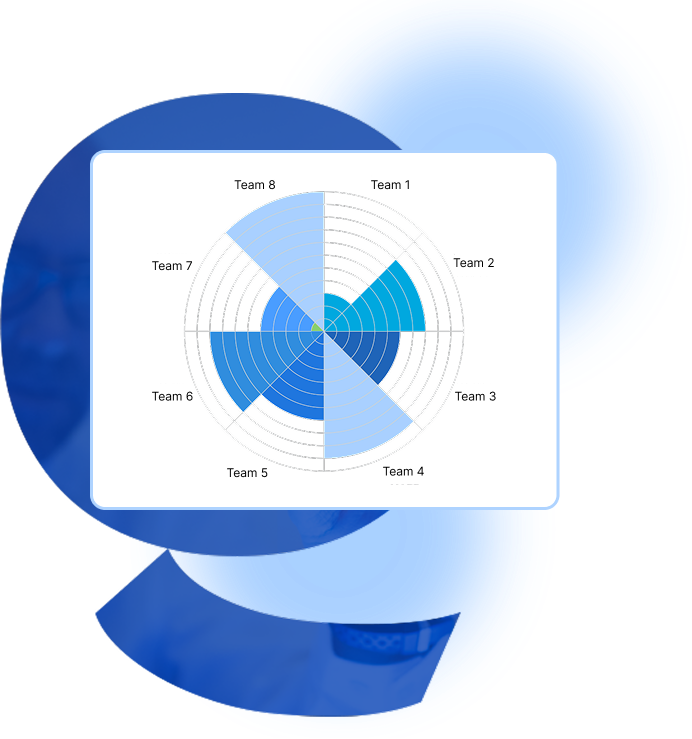

The chart is organized in a circular manner, with the center representing the origin and the outer edge representing the maximum value.
A step-by-step guide for creating a Polar Area Chart through Fibodash Editor:
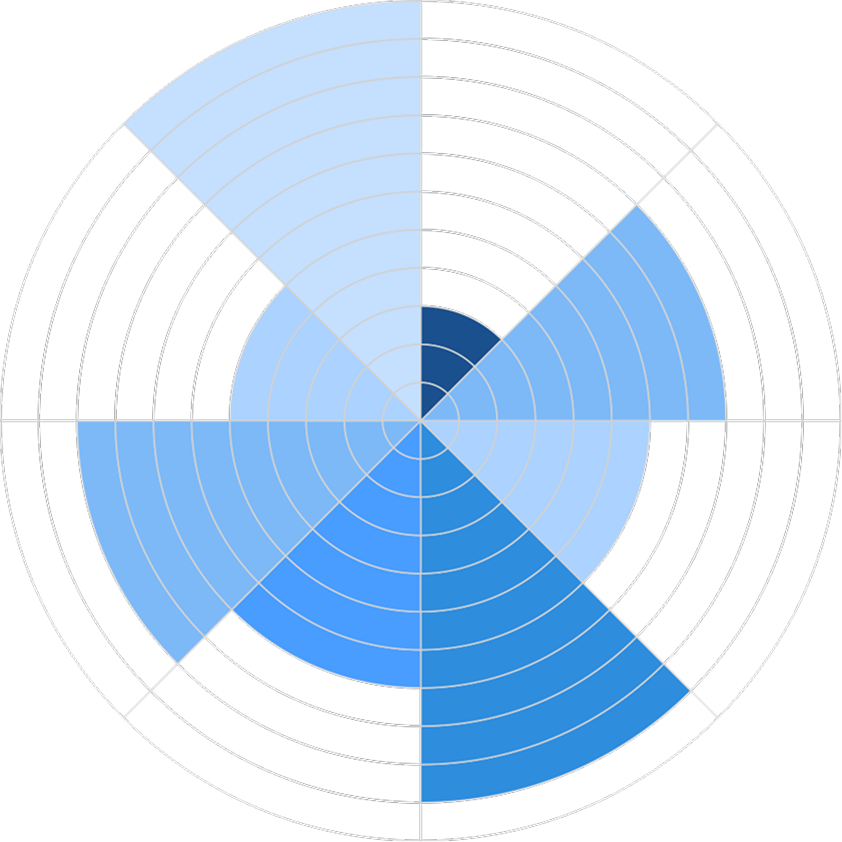


A Polar Area Chart is a data representation in an angular graph. Every point or radial line represents more than one variable across categories of different kinds.

Fibodash Editor transformed how we present data. The AI-powered insights and seamless interactive editor make complex visualizations effortless and dynamic. It was like having a data scientist and a designer in one tool!

Explore our insightful blog posts


All Rights Reserved. © 2026 by Fibodash.